
Enhance Your Edge With Custom Indicators
One of the few Trusted Pine Programmers backed by TradingView
Free Indicators
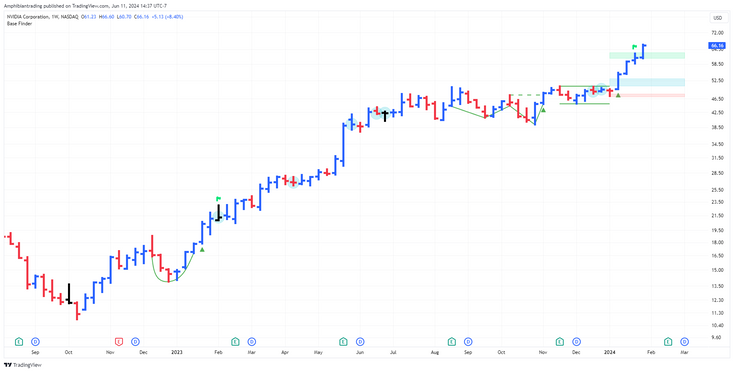
Base Finder
The Base Finder is a powerful tool to identify consolidation periods in a stock's advance. With this indicator, traders can effortlessly spot consolidation patterns on their charts providing them with a deeper understanding of the stock's price action.
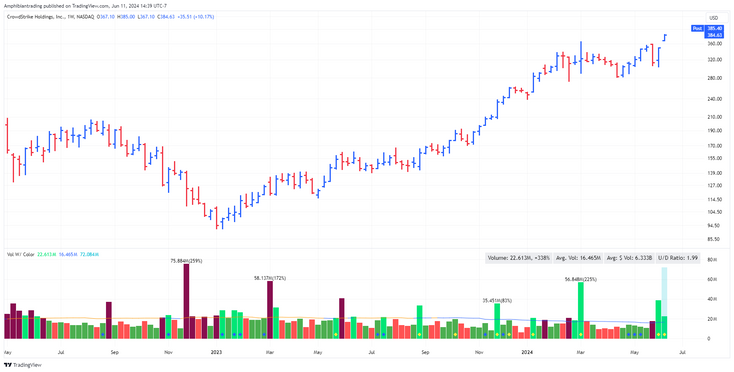
Volume with Color
Volume with color helps to quickly identify accumulation or distribution. This indicator shows pocket pivots, highest volume ever, highest volume 1 year, dollar volume, up down volume ratio.
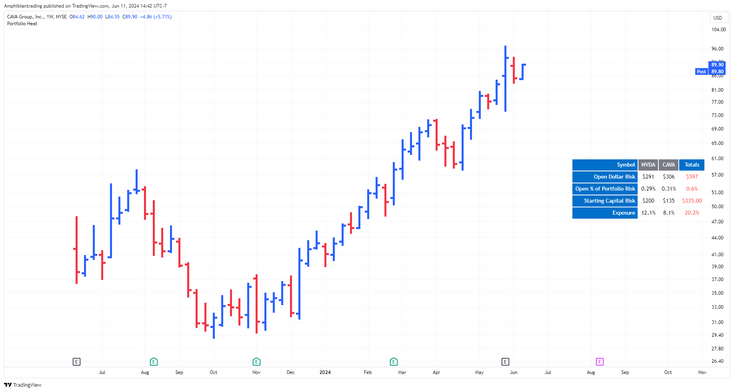
Portfolio Heat
The "Portfolio Heat" indicator offers a visual representation of potential risk exposure for a portfolio across up to eight different symbols. It dynamically calculates three risk metrics based on current price, the number of shares owned, your designated stop loss, and total account size.
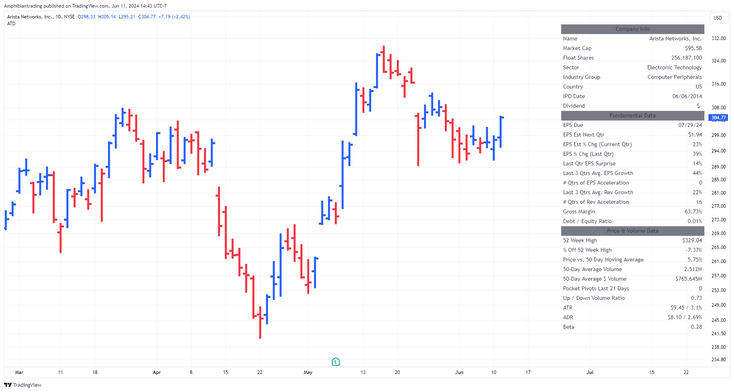
Analytics Dashboard
The Analytics Trading Dashboard is a tool designed to bring key information about a company into an easy-to-view dashboard. The indicator combines Company Info, Fundamental Data, Price & Volume Data, and Analyst Recommendations all into one table.
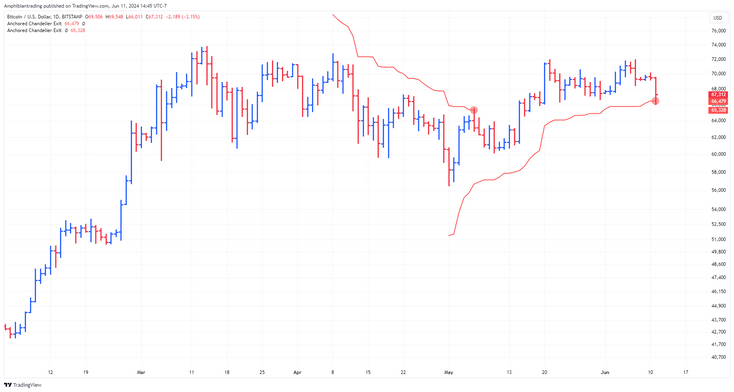
Anchored Chandelier Exit
The Chandelier Exit is a popular tool among traders used to help determine appropriate stop loss levels. This indicator builds upon the original Chandelier Exit by allowing the trader to select an anchor date or starting point for the indicator to begin calculating from.

Trade Risk Manager
Equity Trade Risk Manager calculates your ideal position size or ideal stop loss based on your account size, purchase price and risk tolerance. This ensures you are never risking more than your predetermined amount on each trade
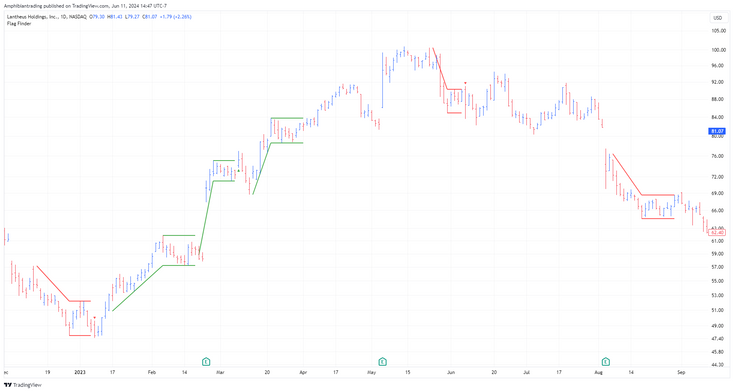
Flag Finder
Flag Finder Indicator is a technical analysis tool to identify bull and bear flags.
Premium Indicators
Screener
Receive a curated list of high-quality growth stocks with winning characteristics delivered directly to your inbox every night.
📝 What’s included:
1. Universe List:
To be included, each stock must meet specific criteria:
- Be above its 200-day simple moving average.
- Be less than 30% off its 52-week high.
- Have its latest earnings or revenue year-over-year growth exceed 25%.
2. Curated Lists:
The Universe list is then narrowed down into the following lists:
🏦 Bases List:
Contains stocks currently in a basing pattern such as flat bases, cups, cup with handles, double bottoms, high tight flags, and consolidations.
📈 Pocket Pivots:
Features stocks that had a pocket pivot volume signature. A pocket pivot is an up day where the volume is greater than the largest down day volume of the past 10 days.
🔄 Mini Coils:
Includes stocks in a mini coil that is 5 days or less. A mini coil is when multiple bars are nested inside a larger bar.
📊 Kickers:
A kicker is a two-bar pattern. The first bar closes lower than it opened, the second bar opens higher than the previous bar's open.
🚀 Upside Reversals:
Requires the current bar's low to undercut the previous bar's low and finish with a closing range of 60% or better. The low must also be below either the 21 EMA or 50 SMA and close back above the moving average.
📉 RS New High:
Features stocks whose relative strength line made a new 3-month high.
📆 52 Week High:
Contains stocks that hit a new 52-week high.
🔥 3 Bar Breaks:
A powerful move (up or down) where a stock takes out the previous 3 bars' highs or lows.
🐜 Ants:
Developed by David Ryan, Ants occur when a stock is up 12 or more of the past 15 days, the volume over that period is 20% or more above average, and the price increased at least 20%.
💵 EPS:
Lists stocks that are reporting earnings in the current week.
📅 Economic Reports:
Includes the next day’s high-importance economic reports.
⏰ Reports Timing:
- Sent out at 5:20 PM EST for the US market.
- Sent out at 5:00 PM IST for the Indian markets.
Custom Indicators
FAQ
Q: What is your hourly rate?
A: Projects are quoted and billed on a per-project basis at $75/hour. This is quoted up front based on the details determined for the individual project.
Q: What type payment is accepted?
A: I use Stripe for payments, which accepts credit cards. All invoices are in USD.
Q: What is the process like?
A: After submitting your request form, I will review the project and reach out via email with a final quote and any additional questions I may have. From there work is started. Once I have completed the indicator a private invite-only link is set for testing. Upon testing and final payment the source code and instructions on how to add the indicator to your chart will be delivered.
Q: Can I have revisions done after the source code has been delivered?
A: Yes, minor revisions are included at no charge. Major revisions will incur additional fees.
Q: Can you make changes to this code I found?
A: Yes, but the minimum project fee is $75.
Q: Refund policy?
A: No refunds will be issued, that is why it is very important to be as clear and detailed as possible when filling out the indicator request form.
Q: Can you code Strategies?
A: Yes, I can code strategies to be used with TradingView’s built in back tester or create a manual back test.
Q: Will you create a strategy for me?
A: No, I do not create trading strategies. I take your strategy and code it into an indicator.
Still have questions?
email me: amphibiantrading@gmail.com
